 Documentation
Layers
Most applets show a widget as below in the lower left corner:
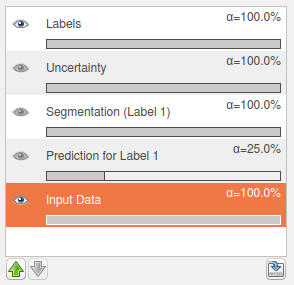
Shown is a list of layers. These layers show datasets with the same extent as the original data (Input Data), from which they were derived. Examples are predicted pixel probabilities or segmentation.
Layers can be thought of as a stack of transparencies. In the above example, the Input Data layer comes first. On top of that, we overlay - in this order - Prediction for Label 1, Segmentation (Label 1) _, _Uncertainty, and Labels.

 shows whether this layer is visible or not. Invisible
layers are ignored.
shows whether this layer is visible or not. Invisible
layers are ignored.
Each layer’s transparency is indicated by the gray bar below its name, and the opacity (alpha) is shown. 100% means a fully opaque layer, while 0% means a completely transparent layer. The amount of transparency can be changed by clicking the gray bar.
 Layers can also be reordered to change their position in the stack.
To do this, first highlight a layer by single click (in the example above,
the Input Data layer is highlighted), then use the up/down arrows on the
lower right.
Layers can also be reordered to change their position in the stack.
To do this, first highlight a layer by single click (in the example above,
the Input Data layer is highlighted), then use the up/down arrows on the
lower right.
 To export the data that is shown by the currently highlighted layer,
press this button.
To export the data that is shown by the currently highlighted layer,
press this button.
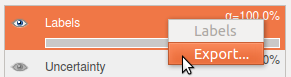
Alternatively, a layer’s contextmenu (right click) can be used to access the same layer export functionality.
The export dialog is described in the data export section.